Most e-commerce teams believe they have an analytics problem. They don’t. They have a decision system problem.
They’re collecting data. They’re building dashboards. They’re running weekly reports. But when it’s time to act — to reorder stock, reallocate budget, or retain a customer who is quietly leaving — the system goes silent.
The root cause is a mismatch between the type of analytics they’ve built and the type of decisions they actually need to make. In this article, I’ll break down the structural difference between reactive analytics and predictive analytics, and explain when each is the right choice for your e-commerce operation.
What Is Reactive Analytics?
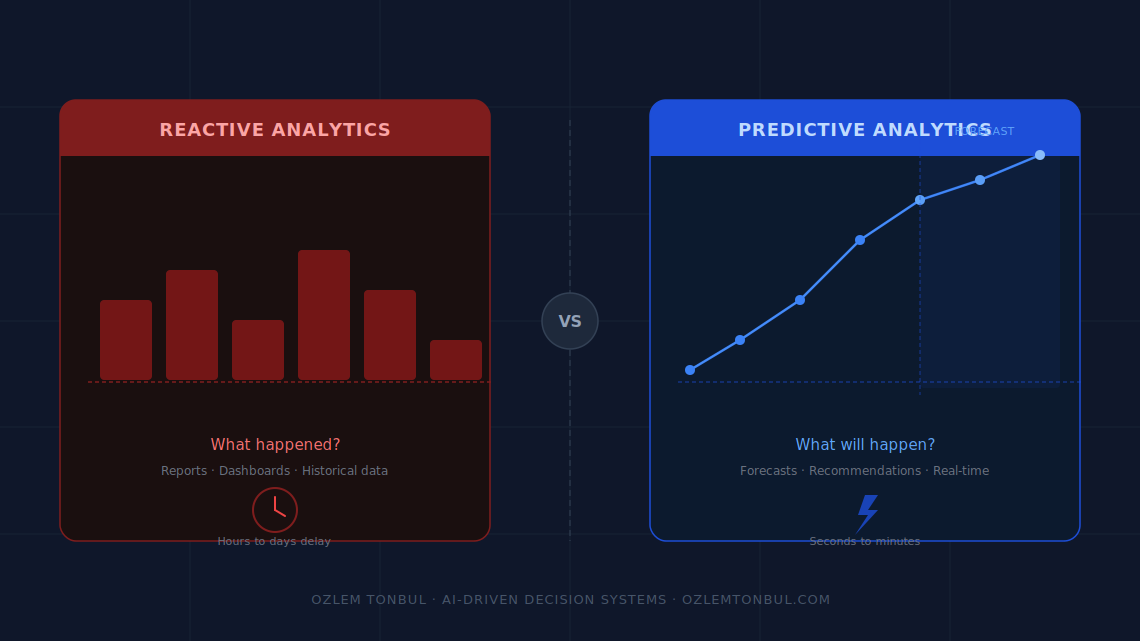
Reactive analytics answers one question: “What happened?”
It is built on historical data — structured to describe past events through reports, dashboards, and scheduled queries. Most BI stacks (Looker, Power BI, Tableau, or a custom SQL layer) fall into this category by design.
As I explored in Why Dashboards Don’t Drive Decisions, the fundamental problem with reactive systems is not the technology. It’s the design intent. They were built to inform, not to act. A dashboard that shows a red KPI still requires a human to see it, interpret it, open another spreadsheet, email a manager, and wait three days before a decision is made. That process is reporting — not intelligence.
Where Reactive Analytics Works Well
- Tracking KPIs over defined time periods
- Post-campaign ROAS and attribution analysis
- Revenue and margin reporting by product category
- Historical cohort analysis for customer behavior
- Compliance and finance reporting
Where It Breaks Down
The moment your business requires a decision faster than your reporting cycle, reactive analytics becomes a liability. If a stockout happens Tuesday but shows up in the Friday report, you’ve already paid the cost — in lost sales, in customer frustration, in rushed logistics decisions.
“Our stock ran out last Tuesday — we saw it in the Friday report.” This is not a data quality problem. It is an architectural one.
What Is Predictive Analytics?
Predictive analytics answers a different question: “What will happen — and what should we do about it?”
It uses historical patterns to generate forward-looking outputs: a demand forecast, a churn probability score, a budget reallocation recommendation. The key distinction is that the system is designed not just to describe, but to recommend action before the event occurs.
Core Use Cases in E-Commerce
Demand Forecasting. Predicting SKU-level sales volume for the next 30 days to drive inventory replenishment — before stockouts happen, not after.
Churn Prediction. Identifying customers with a high probability of going inactive within 60 days, enabling proactive retention campaigns while there’s still time to act.
LTV Estimation. Scoring new customers by predicted 12-month lifetime value, so acquisition budgets are weighted toward segments with higher long-term return — not just lowest CAC.
Ad Budget Optimization. Using machine learning to dynamically reallocate ad spend across campaigns based on predicted marginal return. In my Google Ads ML budget optimization case study, a Random Forest model improved revenue by 30% without increasing total spend — because it moved budget proactively, not reactively.
Dynamic Pricing. Adjusting prices in near real-time based on demand signals, competitor data, and stock levels — a capability that is impossible to execute manually at scale.
Side-by-Side Comparison
| Dimension | Reactive Analytics | Predictive Analytics |
|---|---|---|
| Core Question | What happened? | What will happen? |
| Output | Reports, dashboards | Scores, forecasts, recommendations |
| Latency | Hours to days | Seconds to minutes |
| Data Input | Historical only | Historical + real-time signals |
| Technical Stack | SQL, ETL, BI tools | Python, ML models, REST APIs |
| Team Requirement | Data analyst | ML engineer + data scientist |
| Decision Trigger | Human reviews report | System triggers alert or action |
| Maintenance | Query & dashboard updates | Model retraining, drift monitoring |
The Architecture Behind Predictive Decision Systems
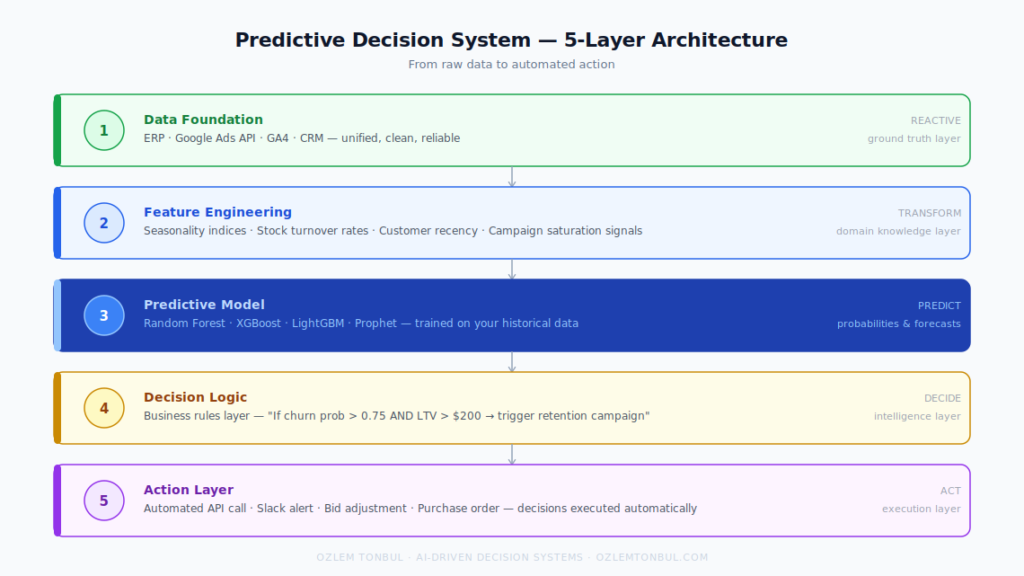
A predictive analytics layer is not a replacement for your existing data stack — it’s an extension of it. As I outlined in my four-layer decision system framework, each layer depends on the one below it.
1 Data Foundation (Reactive Layer)
Unified, clean data from ERP, Google Ads API, GA4, and CRM. Without reliable data here, predictive models are worthless. This is where most projects stall.
2 Feature Engineering
Transforming raw data into model-ready inputs: seasonality indices, stock turnover rates, customer recency scores, campaign saturation signals. Domain knowledge matters more than model complexity at this stage.
3 Predictive Model
Algorithms trained on historical data to output a probability or forecast. For structured e-commerce data, Random Forest and Gradient Boosting (XGBoost, LightGBM) are the most reliable starting points. For time series, Prophet or ARIMA.
4 Decision Logic
The business rules layer that translates model output into a recommendation. “If churn probability > 0.75 and LTV > $200, trigger retention email.” This is the layer most teams skip — and it’s the most important.
5 Action Layer
The output channel: an automated API call, a Slack alert, an automated bid adjustment, a pre-filled purchase order. This is what separates reporting from operational intelligence.
When Should You Build Which?
Start with Reactive Analytics If:
- Your data pipeline is unreliable or incomplete
- You don’t yet have 12+ months of clean transaction history
- Your decision cycle is weekly or monthly — and that’s working
- You haven’t clearly defined your core KPIs
- You don’t have ML expertise in-house yet
Transition to Predictive Analytics If:
- You have 12–18 months of structured, reliable historical data
- You keep experiencing the same operational failures: stockouts, budget waste, churn spikes
- Your team spends more time on manual adjustments than strategic decisions
- You want to scale operations without linearly scaling headcount
- “We saw it in the Friday report” is a phrase your team says regularly
A Practical Example
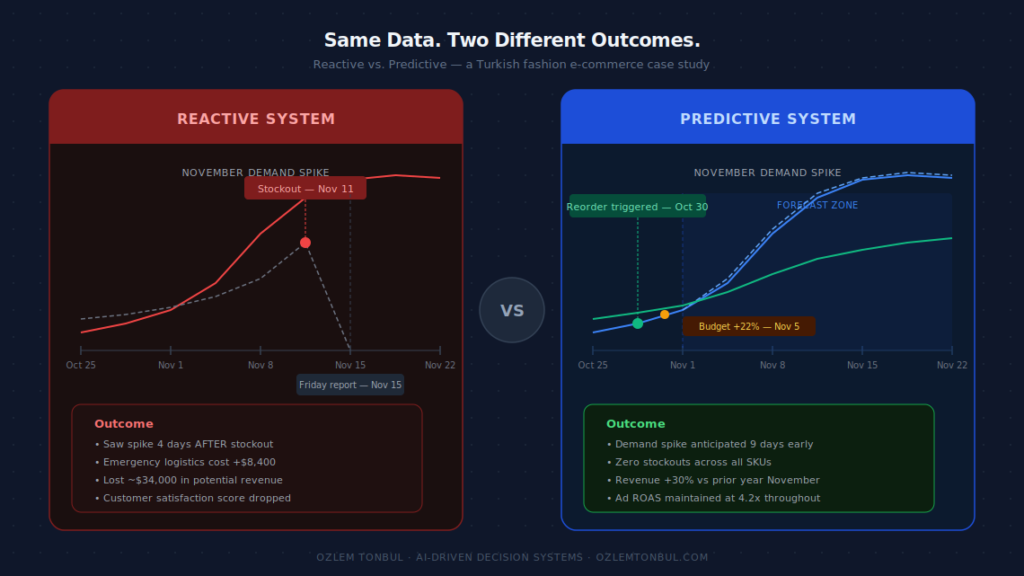
A Turkish fashion e-commerce brand I worked with had a solid reactive analytics setup. Clean dashboards, weekly reports, clear KPIs. But every November, they were caught off guard by demand spikes that outpaced both inventory and ad budgets.
The reactive system told them: “Last November, sales increased 60%.”
The predictive system I built told them, in mid-October: “Demand in your top-3 categories is projected to spike 55–65% starting November 8. Three SKUs will hit stockout within 12 days of peak. Recommended: increase budget allocation by 22% in Campaign Group A starting November 5.”
Same underlying data. Completely different outcome. The reactive system reported the past. The predictive system created room to act before the peak arrived.
Closing Thoughts
Reactive analytics is the foundation — you cannot skip it. But it was never designed to drive decisions at the speed modern e-commerce requires.
Predictive analytics is not about replacing human judgment. It’s about giving decision-makers the right information at the right time, with a recommended action already attached.
The companies winning in e-commerce right now are not the ones with the best dashboards. They’re the ones who built systems that know what to do next — and built that capability before the competition did.
Reactive layer → “Stock turnover velocity is slowing.” | Predictive layer → “This SKU has a 78% stockout probability in 14 days.” | Action layer → Automated purchase order triggered.
Related Articles
Why Dashboards Don’t Drive Decisions: How to Build Data-Driven Decision SystemsGoogle Ads Budget Optimization Using Machine Learning: A Case StudyView All Articles
Looking to build a decision system for your e-commerce operation?
Explore case studies or connect to discuss how predictive systems can be applied to your business.