Most analytics projects end the same way.
A dashboard gets built. Metrics get tracked. Reports get sent every Monday. And three months later, everyone agrees the data is “interesting” — but nothing has actually changed about how the business makes decisions.
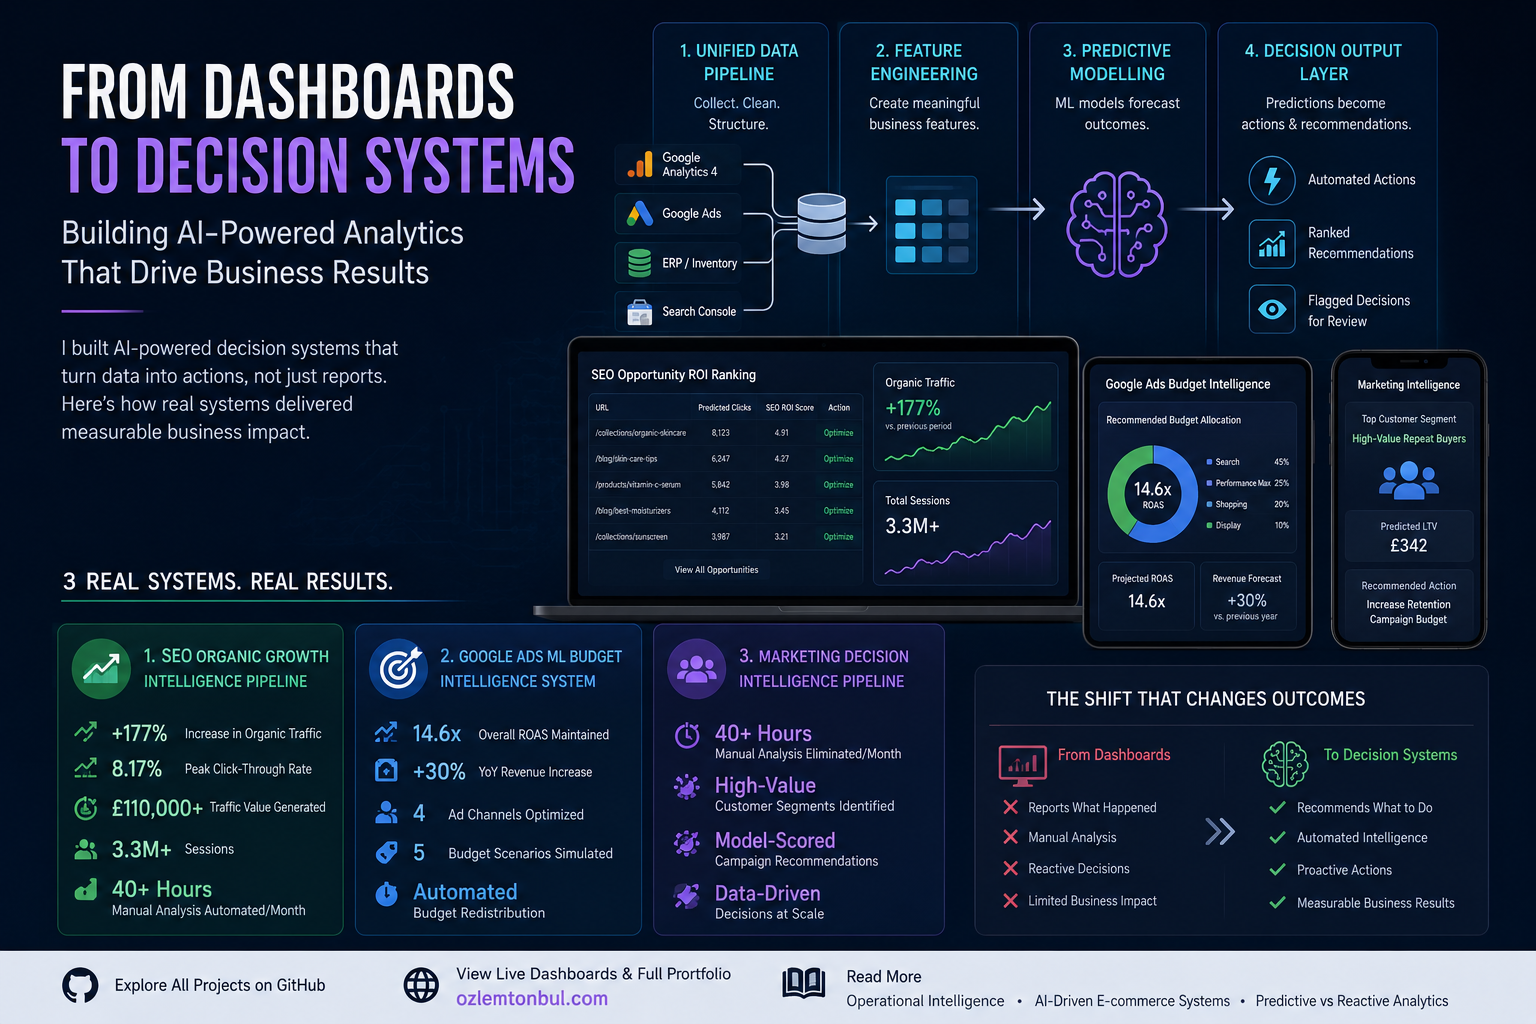
I have spent years building systems that don’t end that way. This article walks through what I actually built, the measurable results those systems produced, and the architecture behind AI-powered decision systems that genuinely change operational outcomes — not just reporting cadences.
Why I Stopped Building Dashboards and Started Building Decision Systems
The turning point came when I was working on an e-commerce analytics project where the team had GA4, Google Ads, ERP exports, and weekly SEO reports — all running in parallel, all disconnected from each other.
The marketing team was increasing ad spend. The inventory team was struggling with stockouts. The SEO team was optimising pages that had no conversion potential. Every team had data. No team had a shared decision layer.
As I explored in Why Dashboards Don’t Drive Decisions, the problem is rarely a data shortage. It is a decision architecture problem. You can have perfect dashboards and still make systematically bad operational decisions — because dashboards report what happened, not what to do next.
AI-powered decision systems solve this not by adding more data, but by creating a structured layer between data and action.
What I Actually Built: Three Real Systems, Measurable Results
Rather than abstract theory, here are three systems I built and the specific outcomes they produced.
1. SEO Organic Growth Intelligence Pipeline
The problem: An e-commerce site with 50,000+ URLs where analysts were spending 40+ hours per month manually reviewing Google Search Console data — with no way to prioritise which pages would actually generate ROI if optimised.
What I built: A machine learning pipeline using Python that processed 50,000+ URLs, engineered 30+ features per URL, and applied a Random Forest model to forecast clicks. The system computed an ROI score for each URL — predicted traffic value gain divided by estimated implementation cost — so optimisation decisions could be ranked by expected return, not just traffic potential.
The result:
- +177% increase in organic traffic
- 8.17% peak click-through rate
- £110,000+ in traffic value generated
- 3.3 million+ sessions
- 40+ hours of manual analysis automated per month
The system is documented on GitHub and the interactive dashboard is live at ozlemtonbul.com.
This is what SEO intelligence looks like when it functions as an AI-powered decision system rather than a reporting tool: not “these pages have low CTR” but “optimise these 12 pages first — here is the expected ROI for each.”
2. Google Ads ML Budget Intelligence System
The problem: A company with 65% year-over-year ad spend growth across four channels. Manual budget decisions were failing to keep pace with scale, seasonal spikes, and multi-channel attribution complexity.
What I built: A machine learning pipeline using Random Forest Regression that simulated five budget allocation scenarios per campaign, generated explicit AI-scored recommendations, and connected directly to the Google Ads API for execution. The system incorporated Anthropic context models for recommendation generation.
The result:
- Overall ROAS held stable at 14.6x during a 30% YoY revenue increase
- Budget redistribution decisions automated across four ad channels
- Seasonal demand spikes handled systematically rather than reactively
Full technical documentation: GitHub — Ads ML Budget Intelligence | Interactive Dashboard
This system is a direct application of the principles I described in Google Ads Budget Optimization Using Machine Learning — and the live results validate that data-driven decision making at the budget allocation layer produces measurably better outcomes than human judgment alone at scale.
3. Marketing Decision Intelligence Pipeline
The problem: A US-based e-commerce operation where disconnected datasets meant marketing decisions were manual, reactive, and built on incomplete customer signals.
What I built: A Python ETL pipeline handling data extraction from GA4 and Google Ads APIs, feature engineering, customer segmentation, and a decision logic layer that generated prioritised recommendations for campaign optimisation and customer targeting.
The result:
- 40+ hours per month of manual analysis eliminated
- High-value customer segments surfaced and prioritised automatically
- Campaign decisions moved from gut-feel to model-scored outputs
Repository: GitHub — Marketing Decision Intelligence Pipeline | Interactive Dashboard
The Architecture Behind All Three Systems
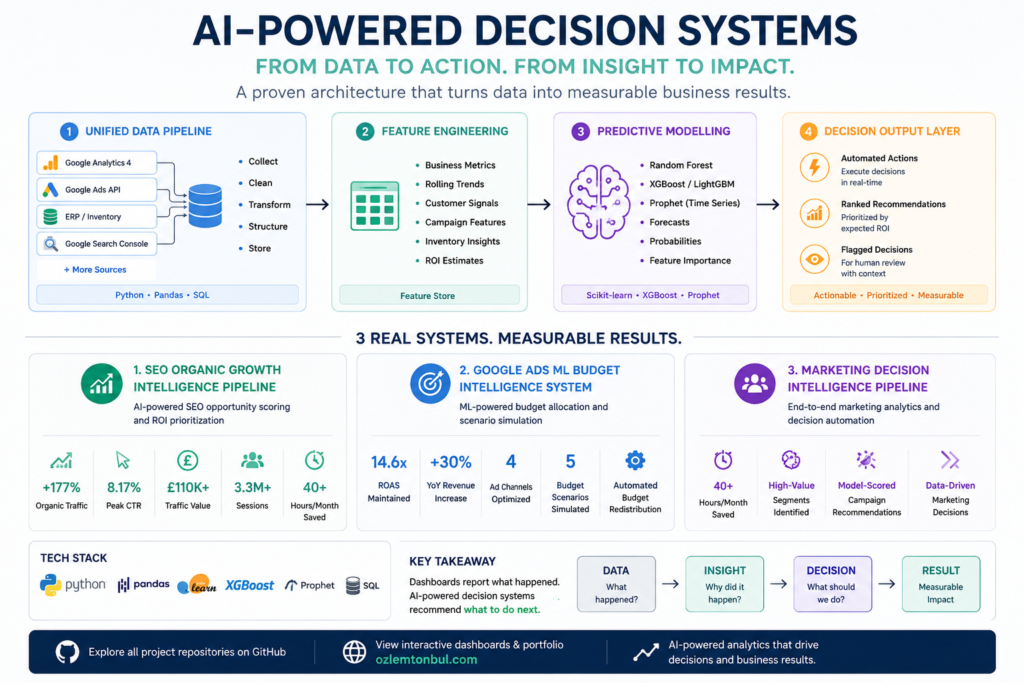
Despite different use cases — SEO, paid media, and marketing operations — all three systems share the same four-layer architecture. This is the framework I apply to every e-commerce analytics project.
Layer 1: Unified Data Pipeline
Raw data from GA4, Google Ads API, ERP systems, and inventory platforms is extracted, cleaned, and structured into a single dataset. Python with pandas handles transformation; SQL handles storage and query logic.
Layer 2: Feature Engineering
Business-relevant features are computed from raw data — rolling revenue trends, RFM scores, campaign ROAS trajectories, inventory days-remaining per SKU, keyword ROI estimates. A model is only as good as the features it learns from.
Layer 3: Predictive Modelling
For most e-commerce use cases, gradient boosting models (XGBoost, LightGBM) and Random Forest outperform more complex approaches because they handle tabular business data well and produce interpretable feature importance scores. For time-series demand forecasting, Prophet is the most practical choice for operational deployment.
The goal is not model sophistication. The goal is a forecast accurate enough to improve a specific business decision. A 68% accurate churn prediction model that triggers a retention sequence is infinitely more valuable than a 94% accurate model that lives in a Jupyter notebook.
Layer 4: Decision Output Layer
This is the layer most analytics projects skip — and the reason most predictive analytics efforts fail to create real business impact.
A prediction without a decision trigger is just another report.
The decision output layer translates model forecasts into one of three outputs:
- An automated action — pause an underperforming campaign, trigger a reorder, send a retention email
- A ranked recommendation with expected ROI — “Optimise these 12 URLs. Expected traffic value: £18,400.”
- A flagged decision for human review — “Campaign A forecast to underperform by Thursday. Recommended reallocation: £2,400 to Campaign C.”
This is what separates an operational intelligence system from a dashboard.
The Practical Starting Point
If you are building your first AI-powered decision system for an e-commerce operation, here is the minimum viable path:
- Pick one decision — the most expensive one your team makes repeatedly with incomplete information
- Connect two data sources — the minimum inputs that feed that decision
- Build the simplest model — linear regression or gradient boosting on 6–12 months of history
- Define the output format — a forecast plus a recommended action, not a chart
- Automate the pipeline — weekly refresh, no manual steps
- Measure prediction accuracy — track real outcomes against model forecasts for 4–6 weeks
All three systems described in this article were built with Python, open-source ML libraries, and Google’s free APIs. No enterprise infrastructure required.
Final Thoughts
The shift from reactive analytics to data-driven decision making is not a technology problem. It is a design problem.
The question is not “what data do we have?” The question is “what is the most important decision we make badly — and how do we build a system that makes it better?”
That question, answered consistently across SEO, paid media, and marketing operations, is what produced the results described in this article.
Explore all project repositories on GitHub. View interactive dashboards and the full portfolio at ozlemtonbul.com. Read related articles: Operational Intelligence · AI-Driven E-commerce Systems · Predictive vs Reactive Analytics